XYZ analysis is a tool for classifying business objects based on their level of stability and the accuracy of predicting their changes over a certain period of time.
As a rule, XYZ analysis consists of the following steps

- Select the object of analysis (inventory, sales, orders, deliveries, and so on)
- Select the parameter by which we will analyze the object (depending on the selected object, for example, the volume of purchases or sales).
- Determine the period for which we conduct the analysis (quarter, half-year, year, etc.)
- Rank the objects according to the coefficient of variation. At this stage, it is necessary to calculate the coefficient of variation for each object. The coefficient of variation is defined as the ratio of the standard deviation to the mean. You can calculate the coefficient of variation automatically in Microsoft Excel.
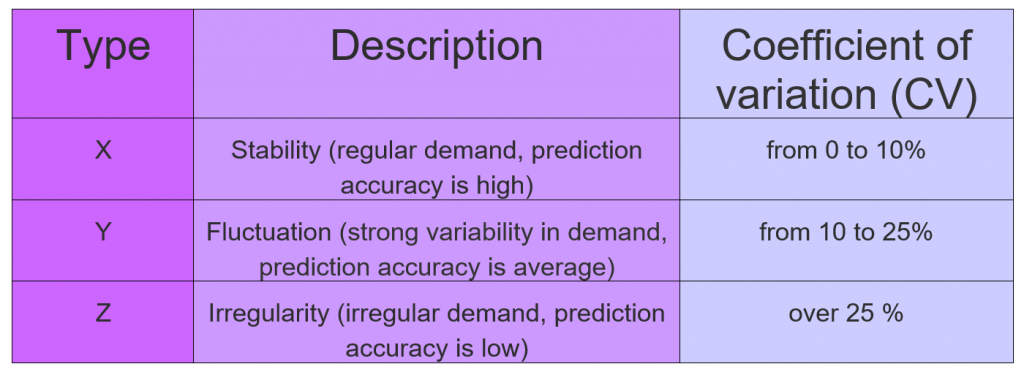
- Divide objects into 3 types:
- Х — coefficient of variation from 0 to 10%
- Y — coefficient of variation from 10 to 25%
- Z — coefficient of variation from 25%
- Analyze the data obtained.
- Х – this type is characterized by stability and a high degree of prediction;
- Y – the behavior of this type is variable, but it is possible to predict;
- Z – this type has a random, one-time nature of demand and is difficult to predict.
Boundaries for object types X, Y, and Z can be defined for each company individually, depending on their operating characteristics. Therefore, the analysis specialist needs to set the boundaries that suit best for your company.
Also, the analysis should take into account that the real value of the coefficient of variation may depend on such reasons as seasonality of sales, promotions, trends, and the like.
Very often, you perform XYZ analysis in conjunction with ABC analysis. This allows you to get more accurate data on the analyzed objects. Based on the results of ABC analysis and XYZ analysis, you prepare the matrix of nine cells that correspond to the objects of analysis.
XYZ analysis matrix
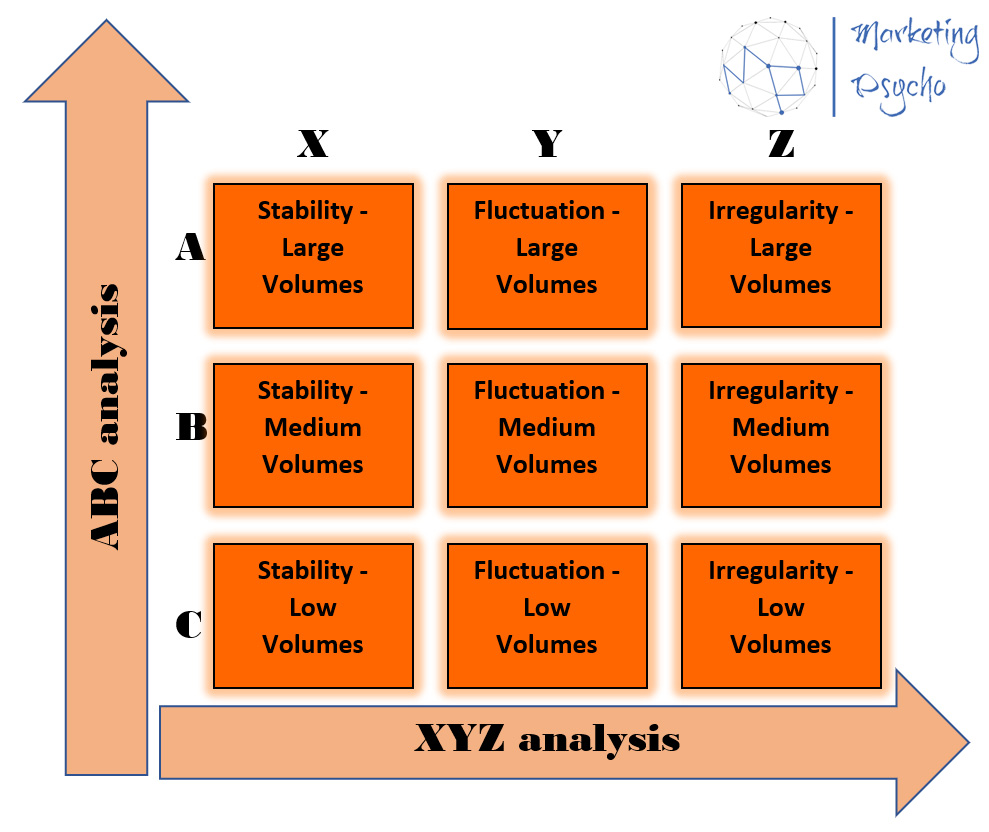
The AX, BX, CX, AY, and BY groups are valuable and predictable objects. They provide the main turnover and are stable, so it is necessary to maintain their availability.
The AZ and BZ groups are important objects that bring a large share of turnover, but are difficult to control. They need special attention.
The CY and CZ groups are objects that require thoughtful analysis.
Objects of the CZ group can be deduced from the company’s turnover when all the facts are compared.
The methods of ABC analysis and XYZ analysis are universal and you can use them for any categories for which it is necessary to conduct a study.
To make it easier for you I’ve prepared the XYZ analysis template which you can download in the Resources section of the website. Now you can run XYZ analysis in no time using Apple Numbers template or Microsoft Excel template. You just need to fill in your data instead of what I used.
To find more marketing analysis tips go to Marketing Analysis section of the website.